Liquid Biopsy in Type 2 Diabetes Mellitus Management: Building Specific Biosignatures via Machine Learning
Makrina Karaglani, Maria Panagopoulou, Christina Cheimonidi, Laboratory of Pharmacology, Department of Medicine, Democritus University of Thrace; Ioannis Tsamardinos, JADBio Gnosis DA, Science and Technology Park of Crete; Efstratios Maltezos, Nikolaos Papanas, Dimitrios Papazoglou, Diabetes Centre, 2nd Department of Internal Medicine, Democritus University of Thrace, University Hospital of Alexandroupolis; George Mastorakos, Endocrine Unit, 2nd Department of Obstetrics and Gynecology, National and Kapodistrian University of Athens, “Aretaieion” University Hospital; Ekaterini Chatzaki, Laboratory of Pharmacology, Department of Medicine, Democritus University of Thrace, and Institute of Agri-Food and Life Sciences, Hellenic Mediterranean University Research Centre
Digital Library: https://www.mdpi.com/2077-0383/11/4/1045
Abstract
The need for minimally invasive biomarkers for the early diagnosis of type 2 diabetes (T2DM) prior to the clinical onset and monitoring of β-pancreatic cell loss is emerging. This paper focuses on studying circulating cell-free DNA (ccfDNA) as a liquid biopsy biomaterial for accurate diagnosis/monitoring of T2DM.
Methods: ccfDNA levels were directly quantified in sera from 96 T2DM patients and 71 healthy individuals via fluorometry, and then fragment DNA size profiling was performed by capillary electrophoresis. Following this, ccfDNA methylation levels of five β- cell-related genes were measured via qPCR. Data were analyzed by automated machine learning to build classifying predictive models.
Results
ccfDNA levels were found to be similar between groups but indicative of apoptosis in T2DM. INS (Insulin), IAPP (Islet Amyloid Polypeptide-Amylin), GCK (Glucokinase), and KCNJ11 (Potassium Inwardly Rectifying Channel Subfamily J member 11) levels differed significantly between groups. AutoML analysis delivered biosignatures including GCK, IAPP and KCNJ11 methylation, with the highest ever reported discriminating performance of T2DM from healthy individuals (AUC 0.927).
Conclusions: Their data unravel the value of ccfDNA as a minimally invasive biomaterial carrying important clinical information for T2DM. Upon prospective clinical evaluation, the built biosignature can be disruptive for T2DM clinical management.
How was JADBio used?
The data were analyzed by ML techniques in order to produce diagnos- tic/monitoring biosignatures of clinical value, combining the novel liquid biopsy-based methylation data emerged by our study and the clinical and demographical data of the study’s groups. The JADBio automated machine learning (AutoML) platform employed for this analysis automatically performs and compares all standard, best practices and ad- vanced ML techniques, and it produces upon feature selection the optimal best-performing model along with the most interpretable one.
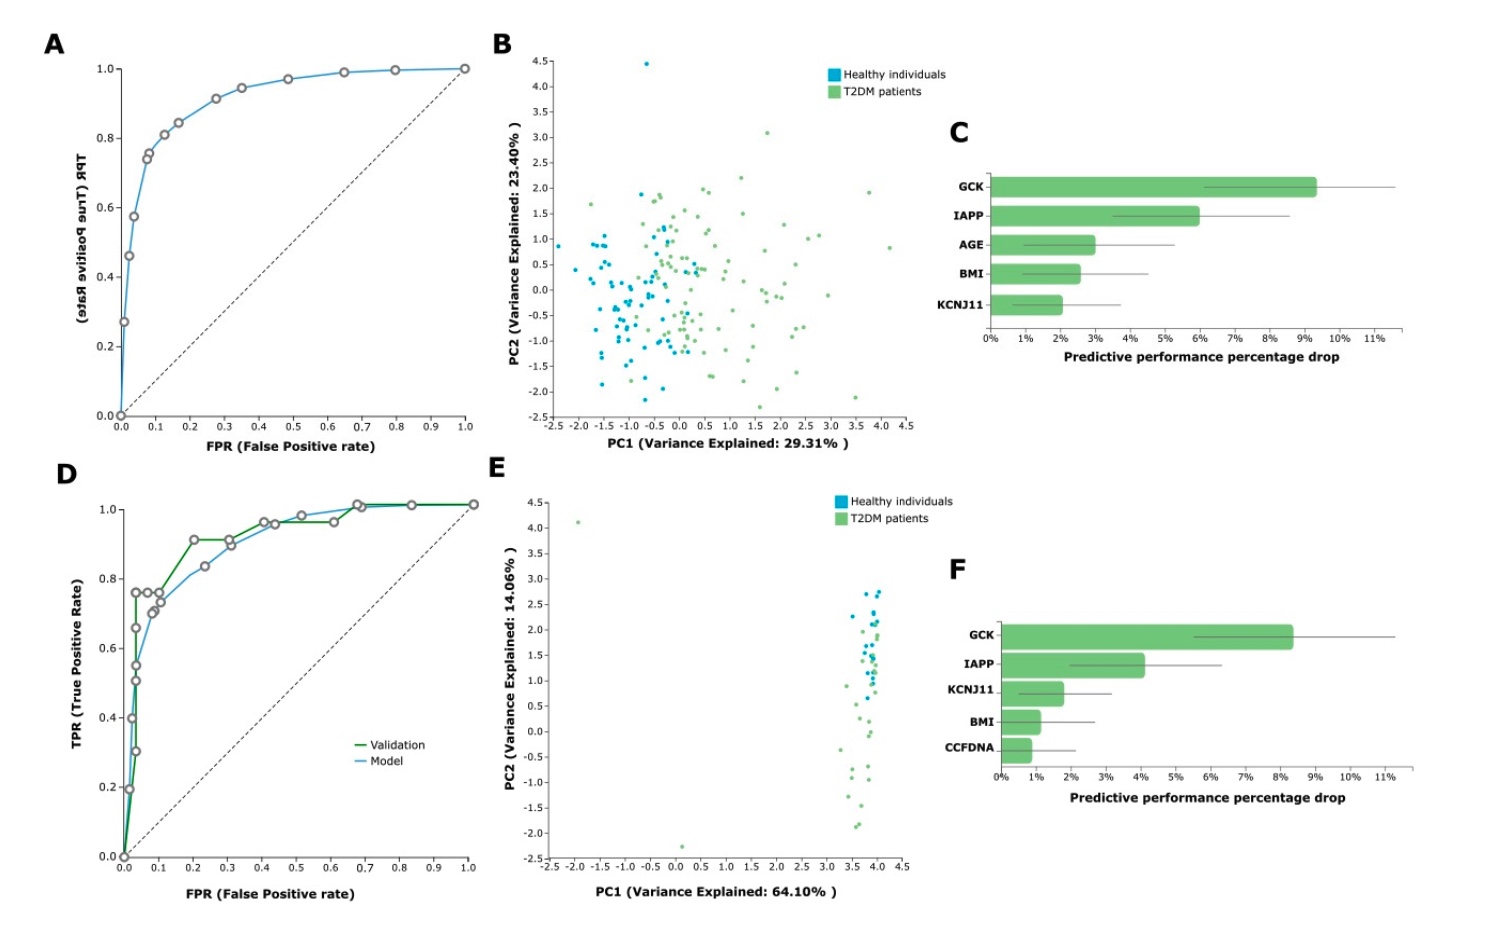
In the AutoML analysis, the task was to predict T2DM versus health from the avail- able ccfDNA parameters and the demographical patient data (age, gender, BMI, etc.). We first analyzed the whole dataset of the 96 T2DM patients on treatment and the 71 healthy individuals (control group). In this analysis, JADBio trained 3017 different machine learn- ing pipelines (also called configurations), corresponding to different model types. Each one was employed many times during cross-validation (a repeated 10-fold CV without dropping), leading to fitting 90,510 model instances (https://app.jadbio.com/share/d59a08fb-e7ea-42e8-8eae-b225f512a38b, accessed on 13 January 2022). This classification analysis produced a best-performing five-feature biosignature via the Classification Random Forests algorithm that was able to discriminate between T2DM patients and healthy individu- als with an AUC of 0.927 (95% CI 0.874–0.967) and an average precision of 0.951 (95% CI 0.914–0.980). Biosignature’s features included GCK, IAPP and KCNJ11 methylation as well as age and BMI, and their contribution in the model’s performance defined as the percentage drop in predictive performance when the feature is removed from the model is shown in Figure 5C. The best-performing biosignature’s performance is presented in Figure 5A,B. The most interpretable five-feature biosignature was also built via a ridge logistic regression algorithm reaching an AUC of 0.915 (95% CI 0.868–0.957) and an average precision of 0.941 (95% CI 0.901–0.975). This biosignature included as features GCK, IAPP and KCNJ11 methylation, smoking status and BMI.

Predictive Modeling Results by JADBio
Most importantly, the size of the dataset allowed for further model automated valida- tion. The whole dataset was split randomly into training and test sub-datasets by a 70/30 ratio via JADBio. In this analysis, JADBio trained 3017 different machine learning pipelines, corresponding to different model types and fitted 150,850 model instances (https://app.jadbio.com/share/42c8c603-06d4-47e7-8276-97d4fa970d6c, accessed on 13 January 2022). The training data from 66 T2DM patients and 51 healthy individuals (control group) led to a similar but not identical best-performing five-feature biosignature via the Classification Random Forests algorithm, which was able to discriminate between patients and healthy individuals with an AUC of 0.898 (95% CI 0.845–0.944) and an average precision of 0.937 (95% CI 0.893–0.968) (Figure 5D,E). The biosignature’s features included GCK, IAPP and KCNJ11 methylation as well as BMI and ccfDNA concentration, all but the last common to the original model from the whole dataset. Validating the model in the test sub-group data from 30 T2DM patients and 20 healthy individuals showed an AUC of 0.923 and an average precision of 0.945, verifying the model’s performance stability. The best-performing biosignature is presented in Figure 5D–F. The most interpretable five-feature biosignature was also built via the Ridge Logistic Regression algorithm reaching an AUC of 0.879 (95% CI 0.826–0.927) and an average precision of 0.921 (95% CI 0.881–0.957). This biosignature’s features included again GCK, IAPP and KCNJ11 methylation, as well as BMI and ccfDNA concentration. In validation in the test dataset, model reached an increased AUC of 0.958 and an average precision of 0.972, again verifying no overfitting in the model construction. Supplementary Table S1 displays the algorithms and tuning hyper-parameter values that JADBio’s AI decided to try in the analysis of the splitted training dataset.
OTHER
Do you have questions?
JADBio can meet your needs. Ask one of our experts for an interactive demo.
Stay connected to get our news first!
Do you have questions?
JADBio can meet your needs. Ask one of our experts for an interactive demo.

Join the JADai Community!
Sign up with a FREE Basic plan! Be part of a growing community of AutoML enthusiasts
GET STARTED


